Study finds California nonprofit sector large in scale but weak in statewide penetration
California is home to the largest nonprofit sector in the United States, but a new study shows the state ranks well below the national average when nonprofit impact is measured by density rather than scale.
According to a Values Economy Index released by Intuitive Digital, California ranks 36th nationally with a composite score of 45.17. The state counts 224,637 nonprofit organizations generating an estimated €610 billion in annual revenue, the highest total of any U.S. state. However, those totals mask weaker performance across key per-capita and per-business measures used to assess nonprofit reach and integration.

Nick Footer, CEO of Intuitive Digital, said the findings highlight a fundamental imbalance. “Density, not dollar volume, is the real measure of a values economy,” he said. “Smaller states are building it more effectively than the largest economies in the country.”
Large Scale, Low Penetration
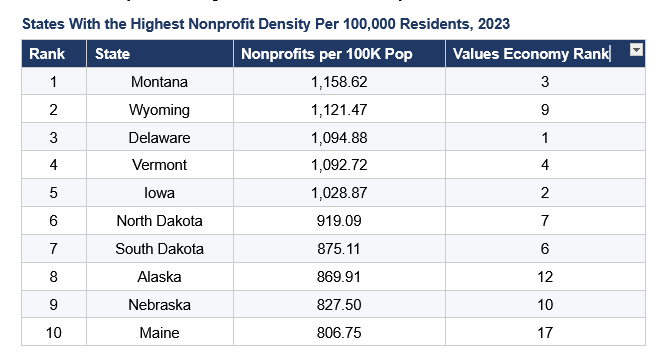
With a population of approximately 39 million, California records 576.51 nonprofits per 100,000 residents, placing it outside the national top tier and below every leading state in the index. Montana, the top-ranked state on this metric, posts more than double California’s nonprofit density.
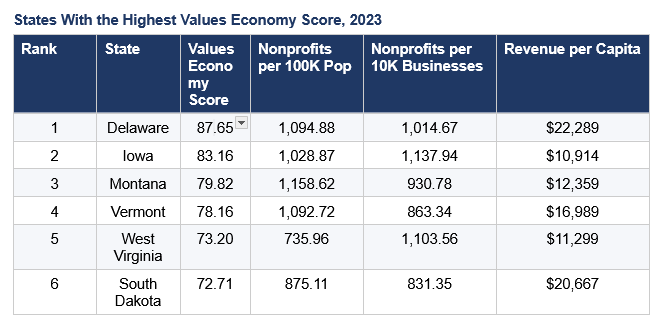
California also ranks 36th in nonprofits per 10,000 businesses, registering 522.41. Iowa leads that category with 1,137.94. The study attributes California’s lower score largely to the size of its business ecosystem, which includes roughly 4.3 million small businesses, the largest base in the country. That scale significantly reduces nonprofit-to-business penetration despite the high absolute number of organizations.
On nonprofit revenue per capita, California reports $15,655, again falling below the national top 10. States such as Massachusetts and Delaware rank substantially higher, driven by stronger per-capita revenue concentration.
How the Rankings Were Calculated
The Values Economy Score is based on 2023 data compiled from CauseIQ, the Small Business Administration, and the U.S. Census Bureau. The composite index weighs three metrics: nonprofits per 10,000 small businesses at 45 percent, nonprofits per 100,000 residents at 35 percent, and nonprofit revenue per capita at 20 percent. Each category was normalized across all 50 states to produce a final score on a 0–100 scale.
Under this methodology, states with far fewer nonprofits and lower total revenue consistently outperform California. Iowa leads the index with a score of 83.16, followed by Montana at 79.82, reinforcing the study’s conclusion that nonprofit density—not sheer economic size—is the defining factor of a strong values economy.
California’s 36th-place finish puts it above only the lowest-performing states and only modestly ahead of Florida, which ranks last nationally in nonprofits per 10,000 businesses. The results suggest that while California dominates in nonprofit volume, it lags in building a broadly accessible and evenly distributed nonprofit ecosystem.